library(reportabs)
labour_force <- read_absdata("labour_force")Plotting ABS Time Series Data
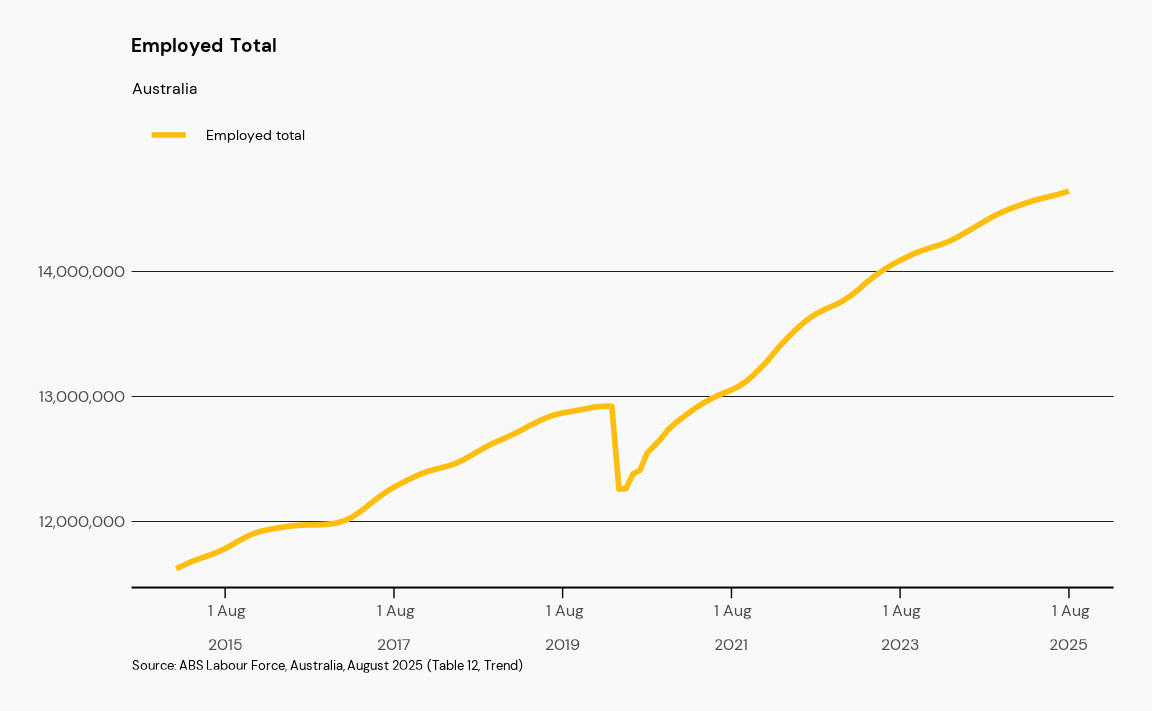
abs_plot() will do most of the heavy lifting for you, if you know the indicator you want to plot. If not, typing plot_ and pressing tab will show the included plots. abs_plot(labour_force, indicator = "Employed total", type = "labour_force") is identical to plot_employed_total("Australia").